
“I am overall very happy with all the product[s] and what has come out of the data. It will help me manage the forest and beyond that it’s pure eye candy.”
Resilient Forestry was contacted by a landowner in the Spring of 2021 to help them understand and effectively manage their property. As a new forestland steward, the land was purchased with the intention of it being a place to spend time with family, to provide quality habitat for wildlife, to contribute towards the sequestration of carbon, and to increase the economic value of the land. With a variety of goals and enthusiasm for creative solutions, our client was excited to explore different ways of seeing and understanding the property.
We installed a series of forest inventory plots and used this data to write a forest stewardship plan that abided by all regulatory requirements. This allowed the landowner to have a clear understanding of the property’s current conditions and potential management pathways. The landowner was interested in collecting UAV lidar data for the property, both to enhance the resolution of the descriptions of the resources on the property, as well as identify and locate structurally complex trees on the property- which was of special interest to them. Therefore, we subsequently collected and processed UAV lidar data for the property.
We ended up doing a fairly involved exploration of the relationship between the lidar data we collected and the inventory plots we installed on the property. We collected highly-precise plot GPS locations for each ground inventoried plot, and we were expecting to be able to create some relationships between the field measurements and the lidar data for individual plot areas to model across the property. Unfortunately, six inventory plots turned out to be too few to build a statistically significant model, so we weren’t able to create any significant data products from that analysis.
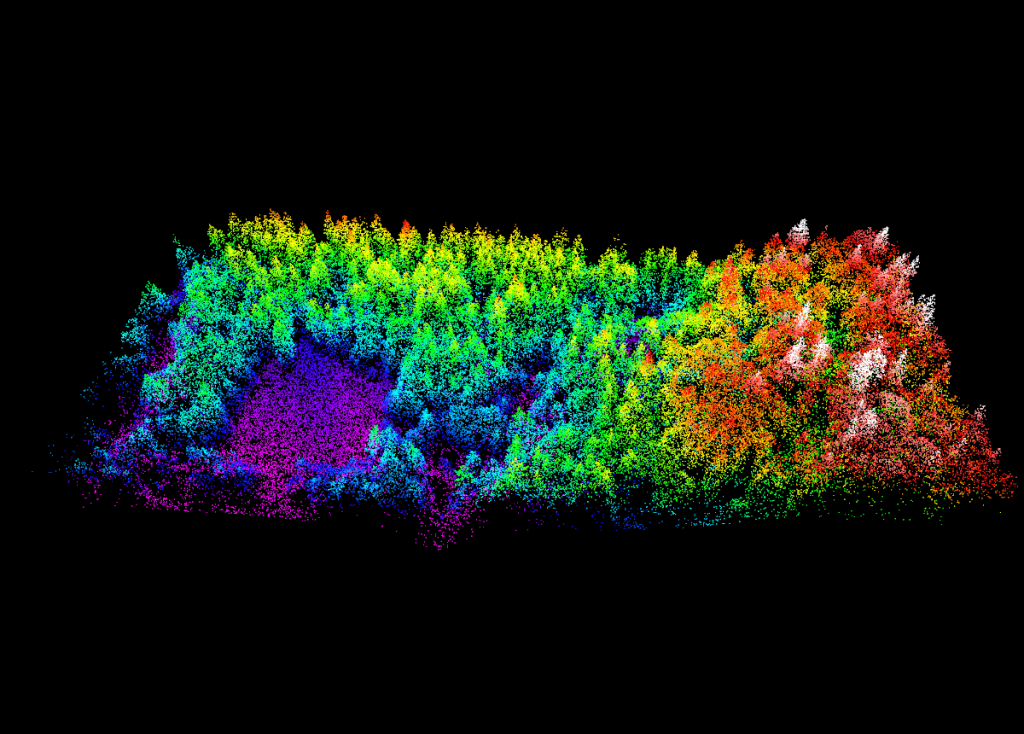
We performed a process known as “tree segmentation” in order to identify what is described as a “tree approximate object” or “TAO.” Each TAO represents a single dominant tree and may include zero or more understory trees or branches from adjacent trees. Due to the nature of how lidar data describes forest structural conditions, this is currently the best method for identifying individual trees with this type of data. This process involves developing a continuous surface of the forest canopy known as a canopy height model which is then used to perform a watershed segmentation algorithm to identify non-overlapping regions defining the horizontal space in which each TAO exists. We then classified all points by the TAO that they represented.
We developed statistical models based on the field data we collected on the property to estimate three tree inventory metrics including: tree height (ft), height to the base of a live crown (ft), and tree diameter at breast height (in). We applied this model to each TAO. We have also created an animation for each TAO which spins the point cloud data giving a visualization for each TAO (renders). We created a reference map for the property to find the unique identifier for each TAO that we identified, allowing for quick lookups of both modeled data and renders. This pdf was georeferenced and can be loaded onto the Avenza mapping app. This way, the property owner can use a phone or tablet to navigate within the property and find these TAOs on the ground.